サイトの設定

倉庫
言語の設定
通貨の設定
製品
リソース
ビデオライブラリ
Cx Family Common Mode Chokes
0402CT Low Profile Chip Inductors
XAL7050 High-inductance Shielded Power Inductors
XGL4020 Ultra-low DCR Power Inductors

Beyond the Data Sheet: The Need for Smarter Power Inductor Specification Tools

Exploring the Need for Smarter Power Inductor Specification Tools

“Understanding the Data Sheet” is a favorite topic of many technical writers, including this one. Considering the fast pace at which technology advances, these articles can be very helpful for both newer engineers and savvy veterans as they attempt to obtain performance data that can be critical to their design. However, it is important to realize that data sheets are inherently limited. Many key parameters are application dependent, varying with characteristics such as frequency or temperature and making it difficult to capture a component’s performance in a single spec or curve. No matter how clearly the data is portrayed or how cleverly the data sheet is written, manufacturers simply cannot perfectly anticipate how a customer intends to use their products.

Electronic selection and analysis tools help close this informational gap by providing “smarter” technical data, allowing the customer to evaluate the data she wants instead of looking at the picture the manufacturer chose to provide.

Data Sheet Dangers: An Illustration

A key component of dc-dc converters, the power inductor has a significant impact on efficiency, transient response, overcurrent protection and physical size. Only with a clear picture of the pertinent inductor parameters can a user make an informed selection of the best inductor for her application.

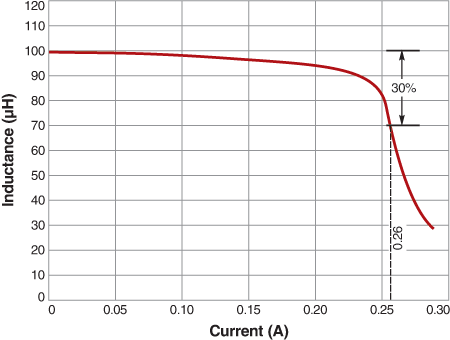
Take, for example, the inductor characteristic of saturation current (Isat), typically defined on inductor data sheets as the amount of dc bias current that causes a specific amount of inductance decrease. This is usually the current that causes 10%, 20% or 30% inductance drop. Let’s examine a nominal 100 µH inductor (Coilcraft part number LPS3015-104) with 30% inductance drop Isat rating of 0.26 Amps.

This rating provides a convenient number with which to compare this part with other inductors, but that’s all it really does. Defining saturation as an inductance drop of 30% is arbitrary and not necessarily meaningful to any particular application. One could just as easily define saturation as 10% or 50% inductance drop.

In fact, inductor manufacturers have used all these definitions at one time or another, generally making fair and direct comparisons between products difficult.

A better picture of inductor performance vs dc bias is provided by looking at the L vs I curve for the LPS3015-104 (Figure 1) instead of a single Isat number. However, the practical task of comparing parts based on the curves can still be trickier than one might expect.

Figure 1. Typical saturation current rating

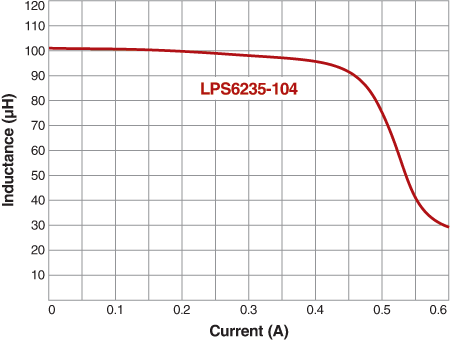
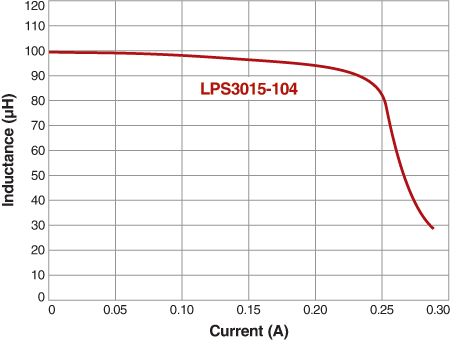
Taking a quick glance at the two curves in Figure 2, one might jump to the conclusion that these two 100 µH inductors have similar Isat ratings. The curves look similar. However, closer inspection is needed to notice the different horizontal scales. In fact, the Isat for the LPS6235-104 is approximately two times that of the LPS3015-104 – not even close!


Figure 2. Saturation current ratings for Coilcraft’s LPS3015-104 and LPS 6235-104 power inductors

Careful reading of the curves by engineers would always lead to this correct understanding, but why make it difficult? The chance for human error would be reduced if the compared parts were shown on the same graph.

Electronic Selection and Analysis Tools

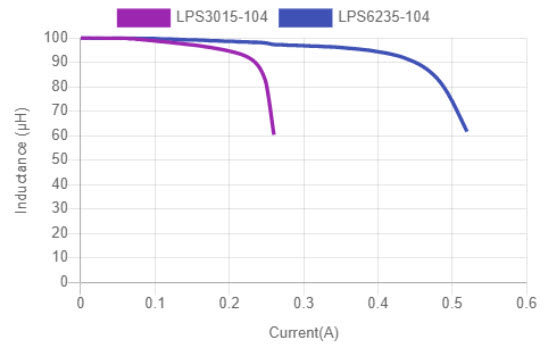
Some online selection and analysis tools now provide this function, providing all the essential product specifications needed for a proper comparison. For example, Coilcraft’s Power Inductor Finder and Analyzer (Compare Tab) design tool allows a user to select the same two inductors previously discussed and have their L vs I curves plotted side-by-side on the same graph, clearly revealing the LPS6235-104’s superior performance (Figure 3).


Figure 3. Side-by-side comparison of L vs. I curves

In addition to the L vs I curves, the summary provides other pertinent inductor specifications, including DCR, maximum temperature, size, and relative price. Unlike static data sheets, the information is all here in one place, allowing the user to make direct comparisons without having to sift through non-comparable data sheets.

Well-designed tools can also provide deeper, more meaningful product comparisons. For example, with most power designs, it is not very meaningful to know the inductance at zero current. After all, inductors don’t really function without current. What is important is being able to find an inductor that can provide a specific L and I combination.

Inductance at Current

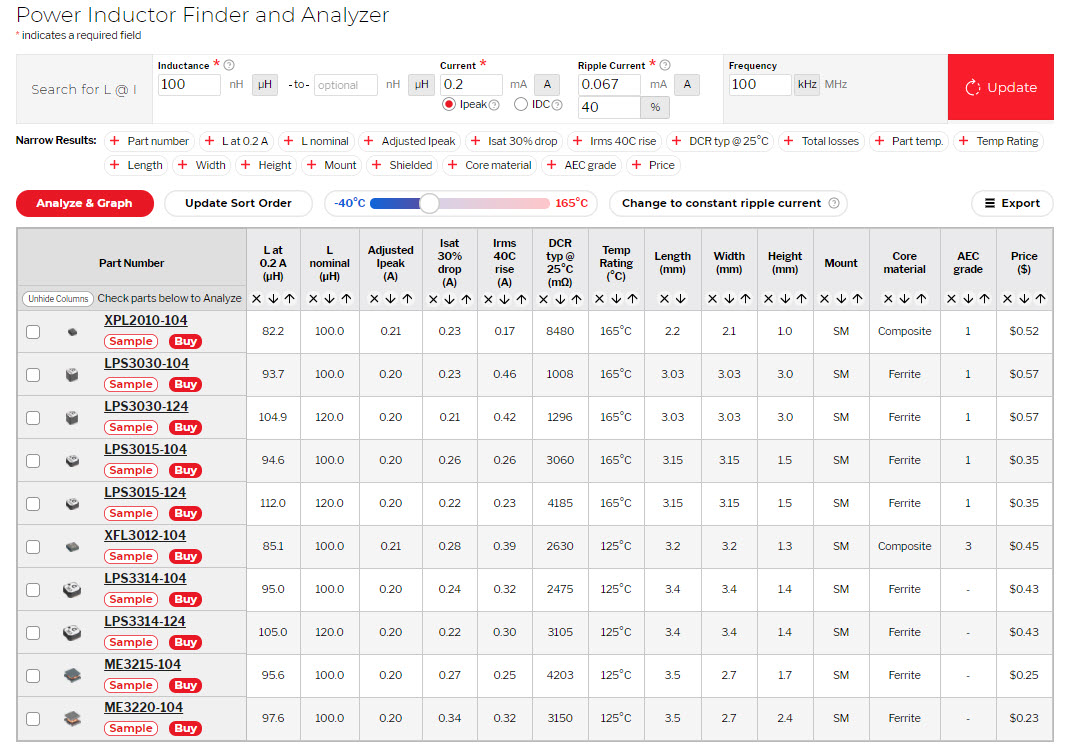
Most inductor manufacturers do offer basic online parametric search tools that allow an engineer to generate a list of products by selecting performance attributes like inductance and current. Some of these tools allow the user to sort the list (by height, for example) to help her identify the best parts for her application. Unfortunately, too many manufacturers’ design tools stop here, leaving it to the engineer to link to specific product data sheets in order to conduct her own analysis. The Power Inductor Finder and Analyzer (L@I Tab) tool (Figure 4) goes further, not only generating a sortable list of products and plotting the L vs. I curves of up to four parts along the same axis for easy comparison, but then also providing important temperature derating analysis.

Figure 4. Coilcraft’s Power Inductor Finder and Analyzer Tool (L@I Tab)

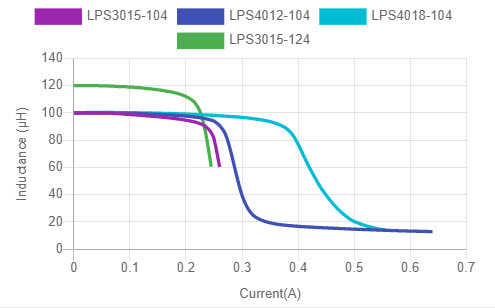
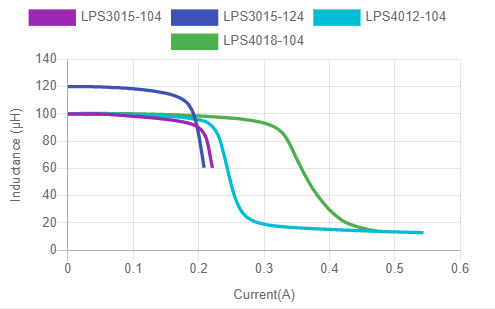
The L @ I search can be performed at any temperature from –40°C to +125°C, with curves shown for the temperature selected and the DCR derated accordingly (Figures 5 and 6).


Figure 5. L vs. I curves at 25°C


Figure 6. L vs. I curves derated for 85°C

This is powerful information for any engineer looking to optimize her design. Consider a case in which the design calls for an inductance value of 100 µH up to 0.2 Amps. Reviewing only the parametric search results, the designer might identify Coilcraft LPS3015-104 as a candidate, but we can see in Figure 7 that this inductor falls below the target of 100 µH at 0.2 Amps.

Figure 7. L vs. I graph for Coilcraft LPS3015-104 power inductor

A logical next step for most designers would be to select a larger part such as the LPS5030-104. The part meets the performance target, but measuring 5.0 mm square compared to the LPS3015-104, which measures 3.2 mm square, this choice would result in a 244% larger footprint.

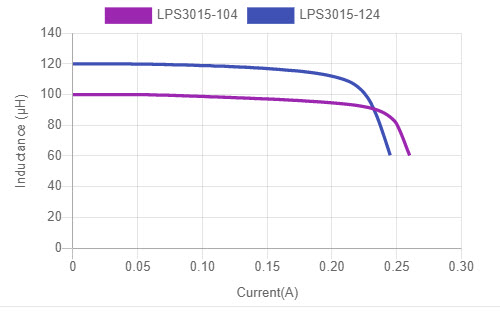
The Coilcraft Power Inductor Finder and Analyzer (L@I Tab) search engine provides a more powerful way of solving the problem. Whereas searching the data sheets for nominal 100 µH inductors will find parts that measure 100 µH, the search engine finds parts with the right combination of L @ I for the application. In the present example, the tool identifies another part of the same size that meets the target at 25°C, namely LPS3015-124. This part meets the application need in the smaller footprint (Figure 8). An engineer carefully browsing through data sheets might find this solution, but it would be much less likely. The search engine provides a richer variety of optimized solutions using dynamic data.


Figure 8. L vs. I graph comparing Coilcraft LPS3015-104 and LPS3015-124 power inductors

An Important Example

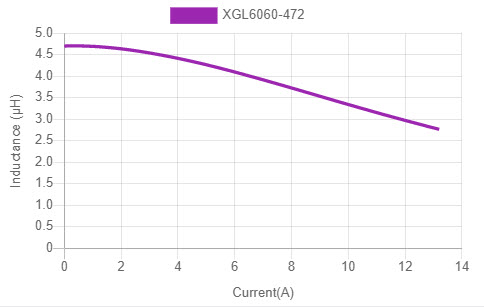
An important trend is the growing use of a new type of power inductor with the core molded around a winding instead of the more traditional winding on a solid core. One characteristic of this technology is a soft saturation curve. Due to the distributed air gap in the molded core, the B-H loop is flattened and the inductor saturates more gradually (Figure 9).


Figure 9. “Soft” saturation curve of Coilcraft XGL6060-472 molded power inductor

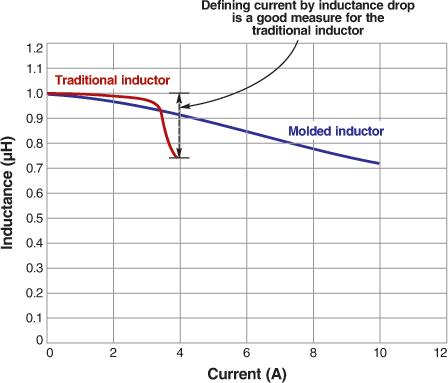
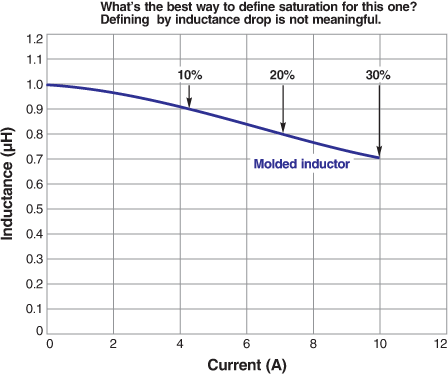
A saturation curve like that in Figure 9 is a good demonstration of the artificial nature of defining saturation by means of inductance drop. The method works well when the curve has a well defined knee, but comparisons between soft saturating inductors using the traditional Isat rating can be greatly misleading, as differences between similar parts are exaggerated (Figures 10 and 11).


Figure 10: Saturation curve comparison between traditional and molded inductors


Figure 11: Comparing soft-saturating inductors using traditional inductance drop can be misleading

Consider the example of comparing the two inductors listed in Figure 12. The DCR of Inductor 2 is 23% better than Inductor 1, and it occupies less than half the board space, but the Isat ratings suggest that Inductor 2 has significantly less L vs. I and won’t handle nearly as much peak current. But the Isat ratings have exaggerated the difference between inductors and the parts are more similar than these ratings suggest.

  Isat(30%) DCR typ PCB footprint
Inductor 1 – XAL6030-332 12.2 A 26 mOhm 36 mm
Inductor 2 – XAL4030-332 5.5 A 20 mOhm 16 mm

Figure 12. This table suggests that there is a great disparity between these inductors


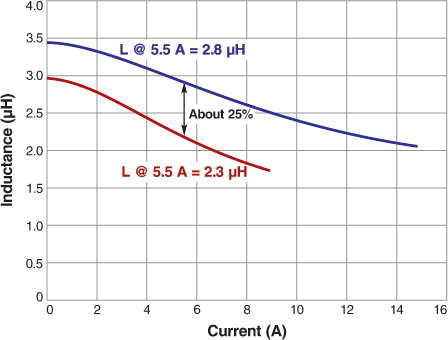
Figure 13. Saturation curves reveals the two inductors are closer than the lsat ratings would indicate

Taking a closer look at the L vs. I curves for these two products (Figure 13), we can see that while the curves are certainly not identical, they are not nearly as different as one would expect from the Isat ratings. Whereas the Isat ratings might imply that inductor 1 has more than 2 × current rating, the true measure of the difference is closer to only 25%.

Isat ratings define the inductor using the zero current inductance as the baseline. A more useful concept is Inductance at Current as calculated by the Coilcraft Power Inductor Finder and Analyzer (L@I Tab) tool. Comparing these two inductors at 5.5 A shows the meaningful difference is 2.9 µH vs. 2.3 µH. This 25% difference is not nearly the difference suggested by the Isat ratings of 12.2 A and 5.5 A. While that extra inductance might or might not be important for any particular design, it is important for the designer to have access to all the right information to make the best choice rather than being limited by traditional data sheet ratings.

Conclusion

Web based selection and analysis tools are powerful additions to the engineer’s toolbox, presenting a more complete picture of product performance, and allowing the engineer to optimize the design.

Doc 1140

Questions or Concerns?

Ask View FAQs


General Applications

Handling and Processing

RF Inductors

Power Conversion

EMI/RFI Filtering

Special Applications