Site Settings

Warehouses
Language settings
Currency settings
Resources
Video Library
Cx Family Common Mode Chokes
0402CT Low Profile Chip Inductors
XAL7050 High-inductance Shielded Power Inductors
XGL4020 Ultra-low DCR Power Inductors

Applying Statistical Techniques to the Design of Custom Magnetics

Design Example

Abstract

The use of statistical techniques for production line monitoring and control (SPC) is an established concept. Creative use of these techniques is also valuable when adapted to the design and specification of magnetic components. This paper introduces a technique for developing meaningful, cost-effective specification by predicting estimates of process capability from a minimum amount of sample data. A toroidal inductor design example is described.

Introduction

Statistical techniques can be applied to the design process, providing off-line quality control similar to the on-line quality control typically provided by SPC. Creating designs that are not sensitive to manufacturing variation plays a crucial role in determining attainable production quality levels. The use of statistical techniques to analyze designs and specifications at the earliest point of the design process leads directly to higher quality and lower cost.

Only a brief working knowledge of statistics is required, and it is not necessary for the designer to become a statistician in order to make use of appropriate design tools.

Predicting process capability and production distributions from a sample toroidal Inductor design is possible using certain techniques. Therefore, reasonable specifications for both functional and physical parameters of the designed part can be determined.

Only variable parameters are considered as opposed to attribute parameters. Attribute parameters are such things as the legibility of part marking and lead solderability. It is important, however, that attribute characteristics not be ignored because it is feasible to have as many defectives for attributes as for variable parameters. Attribute parameter analysis requires production line data. Only variable parameters are appropriate to consider at the design stage.

Statistical Techniques

Statistics can be easily used to check and review component designs and tolerances. The following brief overview provides most of the tools required for such analysis.

Two types of measures may be used to define a random distribution: measures of central tendency and dispersion.

Central Tendency

The most common and useful measure of central tendency is the arithmetic mean, which is defined as:

Doc869-Equations-1.gif               (1)

[x is used to denote sample average, µ is used for population mean]

Measures of Dispersion

The most often used measure of dispersion is the standard deviation (or its square, the variance). The standard deviation, σ, is defined as the average distance from the mean:

Doc869-Equations-2.gif               (2)

where i = 1 to n
[s denotes sample standard deviation, σ is used for the population.]

The Normal Distribution

Most random data in practice are observed to follow a normal (Gaussian) distribution pattern. A normal distribution is a continuous, symmetrical pattern described by:

Doc869-Equations-3.gif               (3)

where –∞ < x < ∞

It is assumed that parameters of interest follow normally distributed patterns. This has been observed in practice to be a good assumption. Further, it can be shown according to the Central Limit Theorem that any group of numbers that represent sums or averages will be normally distributed regardless of whether or not the distribution from which they were drawn is normal. This holds true for magnetic component design because most parameters of interest are functions of a combination of several factors.

Knowing or assuming that data will follow a standard type of distribution greatly facilitates analysis. For example, for normal distributions, eq. (3) can be used to calculate the percentage of parts expected to fall within a certain number of standard deviations from the mean value.

Table 1. Percent Within a Given Distance from the Mean
Expect
68.27%
95.45%
99.73%
99.9937%
99.99932%
99.9999425%
99.9999998%
Within
±1σ
±2σ
±3σ
±4σ
±4.5σ
±5σ
±6σ

Similarly, Table 2 lists the same information in terms of expected ppm defectives versus standard deviation.
 
Table 2. PPM Defectives for Various Specification Limits
Specification Limit
±1σ
±2σ
±3σ
±4σ
±4.5σ
±5σ
±6σ
Expected ppm
317,310
45,500
2700
63
6.8
0.58
0.002

The Design Process

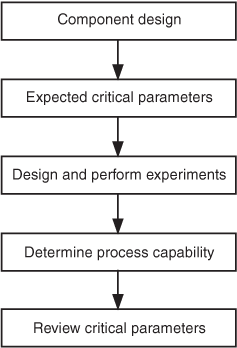
Design must include predictions of production process capability. The design process to be followed here is shown in Figure 1.

Component Design

This is the part of the process in which the inductor design is created. The desired parameters are used to calculate core size, turn count, wire size, mounting hardware, etc.

Example Design Specifications

As an example, assume that the goal is to design a toroidal inductor for use as an output choke for a 20 kHz switching power supply as shown in Table 3.
Doc869-Figure1.gif
Figure 1. Design Process Flow Chart
 
Table 3. Desired Inductor Parameters
Functional:
Inductance = 225 µH ±20%
DC Resistance = 0.100 Ohms maximum

Physical:
PC board Area = 1.5″ × 1.5″ max board.
Height from PC board = 0.675″ maximum
Mounting = header with 0.015″ minimum standoff from PC board.

Quality:
Parts must be shipped at 1,000 PPM defectives maximum.

Inductor Design

Choose Core

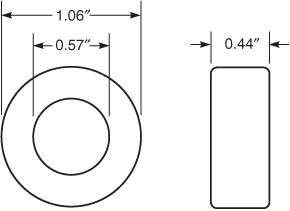
Based on size requirement, start by choosing a 1.06″ diameter powdered iron toroid. This size core in material with 75 permeability is very common, and should make an excellent first choice. The nominal core dimensions are shown in Figure 2.

Doc869-Figure2.gif
Figure 2. Toroid Core Dimensions

Turn Count

The nominal inductance factor (AL) this core is 900 µH per 100 turns. The required turn count for 500 µH is:
 
Doc869-Equations-4.gif               (4)

Wire size

The wire size must be chosen to meet the dc resistance requirement:
 
Doc869-Equations-5.gif               (5)

Doc869-Equations-6.gif             (6)

Check Fit

Core inner circumference = 1.79″
Winding = wire diameter × turns = 0.0281″ × 50 = 1.41″

(1.41″/1.79″) × 360° = 284° of the core ID is required for the winding. This means that the winding should fit comfortably into a single layer. Choose a plastic header for mounting that is 0.060″ thick plus 0.015″ standoffs.

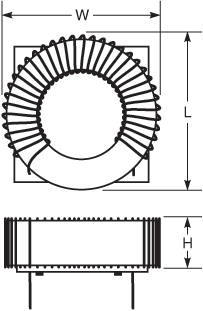
At this point the initial component design has been created, which consists of 50 turns of 22 AWG wire wound on a 1.06″ diameter core. Figure 3 shows the expected appearance of the coil.

Doc869-Figure3.gif
Figure 3. Wound Inductor

Critical Parameters

The next step in the analysis is to review the component design to determine the critical parameters.

A parameter is designated as critical if it is likely to cause a defective part. This is the case if the parameter that is out of tolerance causes the part to be not usable, and if there is some finite likelihood that the parameter will be out of tolerance.

A parameter is likely to be out of tolerance if either the standard deviation is large with respect to the specification limits, or the distribution is skewed too closely to a specification limit.

The reason for focusing attention on critical parameters is cost. There are costs associated with each manufactured defective inductor. There are also inspection costs for each inductor manufactured. Those costs increase with the number of parameters that require inspection. Quality costs are lowest when the combination of cost due to defectives and inspection cost is minimized.

Example

For the toroid design example it is assumed that if the inductance, resistance, length, height, or width are out of tolerance, then the part is a non-usable (defective) item This satisfies the first requirement of a critical parameter. Further, it is assumed that these are the only parameters that can cause a defect. (Attribute parameters will not be considered.)

It is possible to imagine manufacturing or material variations that cause the part to be out of tolerance for inductance, resistance, or any of the three physical parameters. Therefore it is not possible yet to eliminate any of these from being considered critical and we identity five expected critical parameters:
  1. Inductance
  2. DC Resistance
  3. Length
  4. Width
  5. Height
It is important that a final determination of critical parameters not be made prior to the performance of experiments. It is necessary to make a preliminary judgment at this point, however, so that the proper factors will be evaluated by the sample experiment.

The determination of critical parameters can initially be a very subjective decision. If past experience indicates that a certain parameter exhibits little variation then it may be possible to eliminate this parameter from being a critical parameter. Where this is not certain, however, the best approach is to be conservative, and consider all parameters as critical until further evidence demonstrates otherwise.

Design Experiments

The purpose of an experiment during the design stage is to determine which factors influence the variability of the critical parameters in order to create a design that is the least sensitive to these factors. It is important not to optimize the design for the minimum amount of variation for all parameters. This costs money. Although possibly aesthetically unpleasant, non-critical parameters should be allowed to vary.

An entire literature has evolved regarding the subject of rigorous experiment design. A formal experiment tests the inductor sensitivity to variations in manufacturing processes as well as sensitivity to environmental and operating condition changes. This type of analysis can be used during process development and production as well as during the design stage to predict process capability.

It is often neither practical nor necessary to actually perform the arduous task of varying all possible inputs to the inductor and manipulating all possible manufacturing variances. It is especially true if an experimental production run can be used to demonstrate very little variation in the manufacturing process, that it may well be possible to predict process capability from prototype data and prior knowledge of manufacturing processes.

It is often quite possible to predict the range of inductance variation simply based on the core manufacturer tolerance, whereas often the most difficult variations to predict are the physical parameters which are dependent on the manufacturing method. These types of parameters are often overlooked or only briefly considered at the design stage, and yet it is often true for this to be the major cause of defective items.

Prototypes

For custom designed components the design-to-production cycle time is required to be short. For this situation the most effective type of design experiment and analysis tool is a trial run. Often a trial may consist of as few as five pieces.

From the sample data obtained, estimates of production distributions are calculated and compared to the specification limits to achieve an estimate of process capability.

Example

For the design example already discussed two lots of samples were built: a one hundred piece sample designated lot #1 and a five piece sample designated lot #2. The reason for the two sets is to examine the effect of sample size on the predicted process capability. The test results are summarized in Table 4.

It is necessary to estimate σ. To make this estimate from prototype data, it is necessary for the samples to be equivalent to random samples drawn from the production population. To satisfy this, it must be known that either:
  1. The samples are made with the same process constraints, including labor, machines and time allowed as would be used for production, or
  2. The samples are made with a process that is different from, but has been shown by past experience, to be equivalent to the production process. (Or the process may vary from the production process in a known and predictable manner.)
The second method is more practical and economical in that exact duplication of production equipment and materials is not required for the testing of new designs. For sample sizes of 30 or more the sample distribution is sufficiently representative of the population without correction.

From these data, it is seen that the difference between the five piece lot and the one hundred piece lot is not great. In most cases, a very small sample size can be used without significant error.
 
Table 4. Statistical Sample Data
  x s est σ
L (µH) Lot 1
       2
236.3
236.6
2.3
2.9
2.3
3.1
R (mΩ) Lot 1
       2
98.1
97.7
0.82
1.32
0.82
1.4
L (in) Lot 1
       2
1.12
1.12
0.02
0.02
0.02
0.021
W (in) Lot 1
       2
1.14
1.14
0.01
0.003
0.01
0.003
H (in) Lot 1
       2
0.61
0.595
0.02
0.006
0.02
0.006

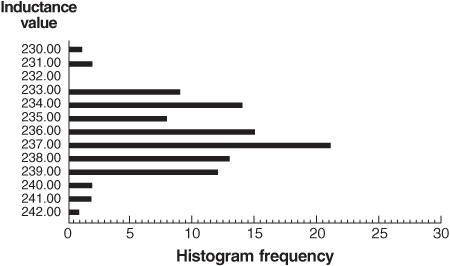
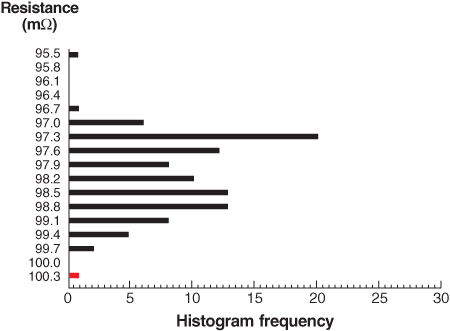
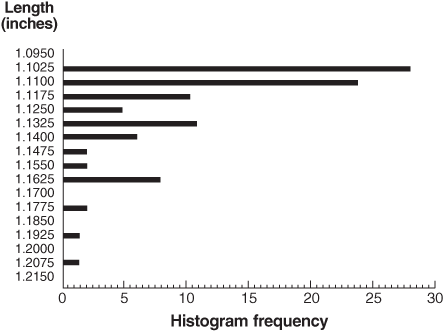
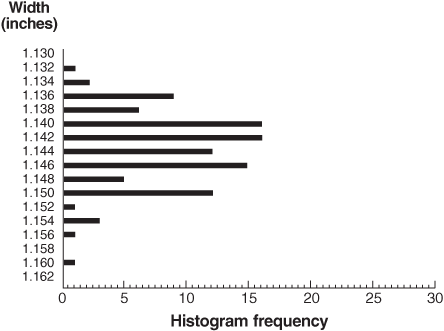
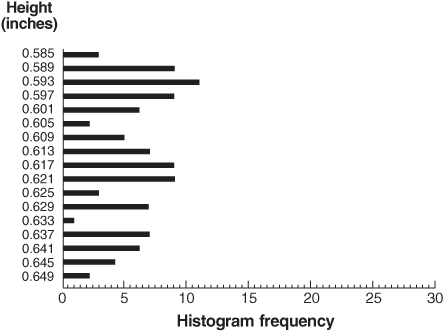
Frequency plots for all five parameters are shown in Figures 4 through 8 for lot #1.
 
Doc869-Figure4.gif
Figure 4. Histogram of Inductance

Doc869-Figure5.gif
Figure 5. Histogram of Resistance

Doc869-Figure6.gif
Figure 6. Histogram of Length

Doc869-Figure7.gif
Figure 7. Histogram of Width

Doc869-Figure8.gif
Figure 8. Histogram of Height

Process Capability

In the previous section it was observed that a trial run produced 100 pieces with only one being defective (one piece being 100.3 mOhm as shown in Figure 5). This defect information alone does not indicate whether or not there are likely to be defectives when larger numbers of the parts are built. It should be noted that a quality level of 1000 ppm corresponds to a percentage defectives of 0.1%. Even a 100 piece sample without defectives alone may not be sufficient to conclude that the design meets 1000 ppm.

Process Capability Index

There are several capability indices commonly used as measures of process capability including CP, CPU, k and CPK. For a simple straightforward estimator of inductor parameters, CP is sufficient. CP is the allowable process spread divided by the actual process spread. It is most common to use six times the standard deviation as the measure of the actual spread. The 6σ rule can be varied In order to achieve designs of differing acceptable outgoing quality level (AOQL).
 
Doc869-Equations-7.gif               (7)
 
It can be seen from equation 7 that it is desirable for CP to be greater than one so that the parts will fall within the required specification.

For the following example a straightforward use of the sample mean and standard deviation alone is a powerful analysis tool. However, for most parts destined for production, it is most beneficial to use one of the common process capability indices. This allows the same terminology to carry over from design to production.

Example

To determine the proper definition of process spread we must refer to the acceptable quality levels. In this example the requirement states that the expected quality is to be 1000 ppm or less. For simplicity, it is assumed that the five critical parameters are the only parameters that can cause defectives, and each one of these will be allowed 1000/5 = 200 ppm each.

Calculations similar to those for Table 4 show that the allowed specification for 200 ppm must represent a ±3.7σ or more. In other words, we will use ±3.7σ to represent the actual process spread and when comparing CP to 1.

Inductance:
CP = (270 – 180) / 3.7 × 2.3 = 10.6 >> 1

The other four parameters are one-sided specifications. Using 3.7σ yields an expected ppm of 100. In this case, the difference between the mean and the specification limit is compared to σ.

Resistance:
(0.100 – 0.098) / 0.00082 = 2.4 (<3.7)

Length:
(1.50 – 1.12) / 0.02 = 19

Width:
(1.50 – 1.14) / 0.01 = 36

Height:
(0.675 – 0.61) / 0.02 = 3.25 (<3.7)

It is seen from the above that length, width and inductance are significantly greater than 3.7 standard deviations away from the specification limits. Resistance and height are not within acceptable limits, however, and can be expected to create quality problems. Table 5 shows a summary of the expected quality level based on the analysis so far.
 
Table 5. Expected Defect Levels
Parameter
Inductance
Resistance
Length
Width
Height
Total
Expected ppm
0
16400
0
0
1200
17600

In other words, we can expect at least 17,600 ppm defects. This may seem a bit surprising since the 100 piece sample lot had only one defect and it was barely over the limit! This design must be corrected for the two questionable parameters.

It is important to note that observing a trial run of parts without defects is not sufficient to predict that there will be no defects in production.

Redesign

The resistance can be decreased by changing the wire size from #22 to #21. The difference in the two wire sizes is 0.003 Ω/ft. Therefore, a change to #21 should lower the mean resistance by 18.7 mΩ, but we would expect the same standard deviation. The new mean of 79.41 mΩ is now 25 standard deviations away from the maximum limit of 100 mΩ. This now yields an expected defect level of 0 ppm.

The increase in wire diameter due to the wire size change is not enough to affect the length and width dimensions or the inductance parameter that were all well within specification, however the height is still a problem.

To improve the design for the overall height specification, a thinner mounting header can be used. A decrease from 0.060″ to 0.040″ thickness should decrease the mean to 0.59″, which would be 4.25 standard deviations from the allowed limit. This yields an expected defect rate of approximately 25 ppm. Table 6 shows the updated summary of expected defects.
 
Table 6. Expected Defect Levels
Parameter
Inductance
Resistance
Length
Width
Height
Total
Expected ppm
0
0
0
0
25
25

Review Critical Parameters

The toroid design example has shown that the application of a few basic statistical concepts is a very powerful tool for quickly identifying possible problem parameters. The techniques used can be more formalized by the use of standard indices for identifying process capability. Formalization provides a common language for design-to- production communication and a good frame of reference for identifying standard process capabilities as a large number of part numbers are brought to production over a long period of time.

Despite the power of a statistical tool, it is (like any other) only as good as the experience and common sense with which it is applied. Even in this fairly simple example, there may have been several factors overlooked in the extrapolation from sample data to predictions of production quality. The validity of the conclusions drawn regarding each of the critical parameters can be examined.

Inductance

The conclusion drawn regarding the percent of expected defects due to inductance did not consider possible lot-to-lot core variations. All pieces were made with cores from the same production lot.

The core inductance tolerance is typically +15%, −7.5%. Cores from three lots were examined, and it was found that although the standard deviation of each lot was fairly similar, the means varied substantially over almost the entire specified inductance range. Therefore the inductance variation will be much greater for long term production than for a single lot. Such parameters are not necessarily disastrous to the design, but must be taken into account.

In the example, the mean was already over the desired nominal inductance of 225 µH, however it was determined that almost the entire difference from nominal was due to the core permeability being over the nominal by the same amount. This was done by measuring a standard winding according to the core vendor catalog. Therefore the worst possible expected mean for the core permeability would be 15% over nominal. This would yield a mean inductance of 259 µH. Assuming the same standard deviation for this average inductance would yield an expected defect level of about 2 ppm; still well within acceptable limits.

Resistance

Experience has shown that coil resistance may vary by as much as 10% due to variations in wire diameter. If we increase the mean resistance expected by 10% we still have an expected defect level of approximately zero.

Length and Width

Both of these parameters were well within tolerance and are not likely to cause defects. The factor most likely to cause significant variation in these dimensions is crossed turns. Because no crossed turns were present in the sample run, none were predicted for production. This is a case where a short run did not give all possible information about possible defects. This can be a problem with sample runs and short productions runs. In this case the only way to obtain further information is to monitor any further production closely. The key to solving this type of problem is to close the feedback loop from production to design engineering so that the next time a similar part is designed, all probable sources of defects are accounted for at the time of design.

The length and width are both candidates for tighter specifications. If both length and width were tightened to 1.3″ max, for example, they would still not be likely to cause defects. Length would then be approximately 9σ and width would be 16σ from the allowed limit. Because circuit board space costs money, the tighter specification of the length and width dimensions would be recommended.

An interesting difference arises between the two dimensions. When comparing the two distributions, it is noticed that length is less on the average than width. This disparity is easily explained by the fact that since the coil does not cover the entire core, the width consists of the core plus two wire diameters, whereas the length only has the core and one wire diameter, as shown in Figure 3.

A question is created why the length would have a greater standard deviation. Upon further examination of the parts it is observed that the coil wires are not always formed identically into leads. In other words the first and last turn of the coil have greater variation than other turns. This is easy to understand but something that could easily be overlooked when specifying tolerances for this part. A simple observation of the two distributions highlights this situation.

Height

The initial analysis of the distribution for the height parameter showed a potential problem, but in the example case, one that was easy to fix. For the redesign, the average part was 4.25 standard deviations from the allowed limit. The height is a parameter that should be targeted for further investigation. A general rule of thumb is that the design should allow for a 1.5σ shift in distribution unless a greater variation is expected, such as in the case of the inductance tolerance. Since we had determined that we should be 3.7 from the limit, being 4.25 away only leaves a margin of 0.55σ shift before the acceptable quality level would be exceeded.

Conclusion

It is seen that applying a few simple statistical techniques to the custom inductor design process increases the effectiveness of analysis and reduces the risk of designing a component that will be a quality problem in production. Cost savings were achieved by saving circuit board area as well as by predicting potential problems with the resistance and the height parameters.

Bibliography

Ellis, Richard W. “Expand the Tolerance, Not the Spec” Quality, April 1987.
Hunter, J. Stuart “Statistics in Quality - Yesterday. Today and Tomorrow” Quality Anniversary Issue 1987.
Jones, Bradley “Beyond SPC: Designed Experiments for Quality Improvement” Quality Dec 1987.
Kackar, Raghu N. “Off-line Quality Control, Parameter Design, and the Taquchi Method” Journal of Quality Technology Vol 17, No 4, Oct 1985.
Kane, Victor E. Process Capability Indices” Journal of Quality Technology Vol 18, No1, Jan 1986.
Micrometals Catalog #4 tor EMI and Power Filters Micrometals, Inc 1982.
Norusis1 Marija J. Starter Stats by SPSS SPSS INC, 1987.
Ryan, Thomas A. Minitab Duxbury Press 1976.
Wadsworth, Harrison M. et al Modern Methods for Quality Control and Improvement John Wiley and Sons 1986.
Wilson, Karen W. “Five Factors in the Quality Issue” Purchasing Nov 5, 1987.

Author’s biography

Leonard Crane is Technical Marketing Manager for Coilcraft, Inc. and holds a BSEE degree from the University of Illinois and a Masters of Engineering Management from Northwestern University.
Doc 869

Questions or Concerns?

Ask View FAQs


General Applications

Handling and Processing

RF Inductors

Power Conversion

EMI/RFI Filtering

Special Applications